Case Study: Service Design for Performance Management · ServiceNow Global People · 2021–2023
Leadership started a journey to improve performance management. They sought guidance on what to fix, in what order, and what good would look like on the other side.
1. CONTEXT
ServiceNow's employee value proposition (EVP) is known as its People Pact. It frames the company's commitment to employees to "live our best lives, do our best work, and fulfill our purpose together." Introduced in 2021, the Pact is a north star for how it treats employees and what it expects of them in return. It provides the framework and resources for employees to pursue their career ambitions, attain skills, and grow professionally. It also explicitly states that the management of those activities will occur on ServiceNow's own products.
2. SITUATION
ServiceNow recently appointed a new VP of Performance and Development. She was building a team and a plan for reimagining how ServiceNow would align its people to fulfill its goals, assess their performance, empower them to seek feedback, and structure their ongoing development on ServiceNow. They had a robust working group of senior leaders as well as quantitative data from the company's employee voice surveys (EVS). They needed a partner to help them connect with the general employee and manager populations as well as someone who could provide guidance on stitching it all together.
3. APPROACH
Start by listening. After reviewing the EVS data and leader voices, I proposed that we dig deep into the problems surfaced by each. They told us where employee experiences were poor but shed little light on root causes or the business impact of the issues. I detailed a plan to conduct a series of journey mapping sessions with a representative sample of managers and individual contributors (ICs). Each session was a conversation. I invited participants to share their experiences and tell stories of how the moments occurred for them, where there were issues and bright spots, and how their experiences may have differed from what they'd expect or want.
Follow by mapping. Those sessions enabled me to visually represent the current state of the annual performance lifecycle. First, as journey maps from the perspectives of managers and ICs. These reflected their experiences, steps, activities, feelings, and ideas for improvement. Second, I created a service blueprint that represented the holistic system including its people, systems, interdependencies, hand-offs, and breaks. These visuals shed light on the highs and lows of the current process. They showed what was working well and the many areas where we needed to focus to improve the future state.
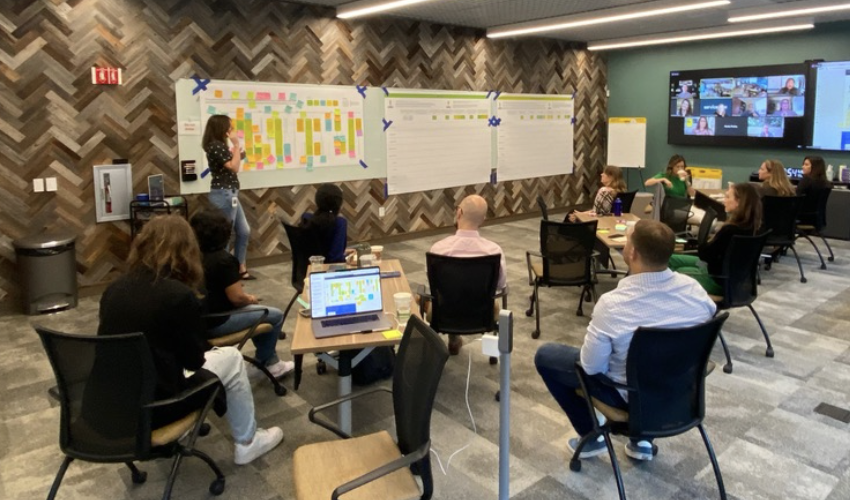
Listen some more. It would have been easy to turn these into slides or a PDF and send them out. But performance management is a big deal. It touches everyone at a company and there are strong feelings about it, many of them negative. For us to succeed, we needed buy-in and ownership. So I printed the outputs of the research as large posters and led a hybrid working session among cross-functional work stream leaders. Everyone internalized the employee voices and stories, took ownership of the failures, and celebrated the wins. We worked together to reframe problems into opportunities and prioritize the work ahead.
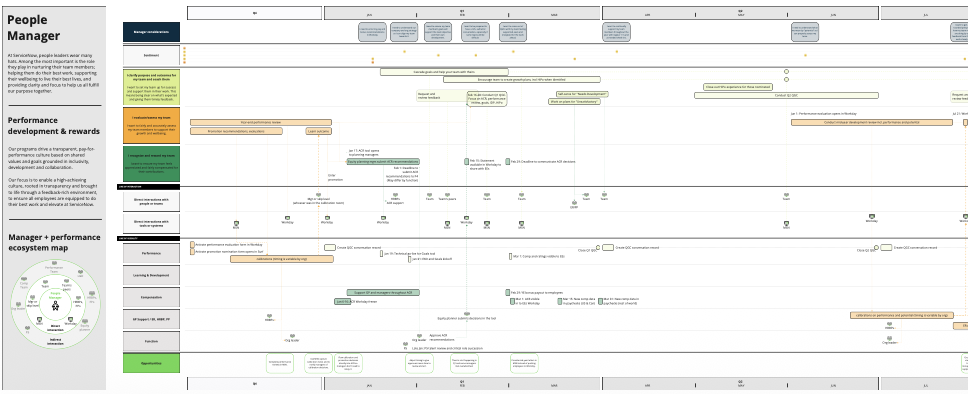
Performance Development service blueprint visualized unknown dependencies
What we learned
- One size would not fit all. The two largest orgs, Sales and Product, had vastly different needs regarding goal-setting and performance measurement.
- Manager behavior was a key driver of team culture, clarity, and motivation. Managers needed to be heard and enabled fully to set the proper tone and expectations with their team. This applied equally to processes and tools.
- Digital components were great for reference and tracking, but needed to support the human-to-human interactions. Rich conversations, willingness to give and receive tough feedback, partnership in goal-setting all needed to happen outside the system.
4. OUTCOMES
The service design approach replaced leadership instinct with evidence-based priorities ranked by employee impact and urgency, shifted the conversation from isolated point solutions to a system-level view of interdependencies, and transformed an unclear vision into validated concepts that were ready for IT scoping.
Highlights
100+ collaborators
Leaders, managers, employees, and HR stakeholders engaged across 2 years of research, sprints, and co-design.
72 ideas and concepts
The cross-functional leader workshop started with employee and manager data and led to 72 ideas the team triaged and prioritized.
30k employees impacted
Solutions that originated through this journey were launched incrementally to the full ServiceNow global workforce.